

A soil test looks like it should say one of two things: “add more fertilizer” or “you’re fine.” Most homeowners treat it like a formality – mail in a bag of dirt, get a photocopy back, glance at one number, toss it in a drawer. Meanwhile, agronomists who read hundreds of these reports every season say the average gardener is missing at least eight out of eleven data points sitting on that exact same page.
Some of those buried numbers explain why your tomatoes stall out every July no matter how much you water them. Others explain something far more uncomfortable – whether your kids should be digging in that dirt at all. Here’s what soil scientists actually see when they read the same report you’ve been ignoring.
#1 – The Real Acidity Number Nobody Reads Correctly
Most people glance at the pH line, see a number between 6 and 7, and mentally file it under “fine.” That’s only half the story.
Soil pH measures acidity or alkalinity on a scale from 0 to 14 – below 7 is acidic, above 7 is alkaline – and it quietly controls how available your nutrients actually are, not just whether they exist in the dirt. Between roughly 6 and 7.5, most nutrients sit in their most available zone. Drift too far in either direction and those same nutrients can be physically present in the soil while staying chemically locked away from the roots.
The mistake almost everyone makes: assuming a “normal” number guarantees a happy plant. It doesn’t. Most horticultural crops do fine between pH 6.0 and 7.5, but azaleas and blueberries want it closer to 5.0–5.5, while other species barely notice high pH at all. A single blanket pH target for the whole yard is often a losing strategy – one bed’s “perfect” reading can be another bed’s slow starvation.
Quick Compare
- Most vegetables & lawns: pH 6.0–7.0
- Blueberries & azaleas: pH 4.5–5.5
- Asparagus & lilacs: pH 6.5–7.5
- Most tree fruits: pH 6.0–6.5
And that first number is only the setup for something almost nobody ever asks about.
#2 – The Hidden “Buffer pH” Line That Determines How Much Lime You Actually Need

Here’s the part almost nobody notices: there are actually two pH numbers on most reports, and mixing them up wastes real money.
Buffer pH measures the soil’s resistance to changing acidity – it’s a completely different reading from your regular pH, used only to calculate how much lime you need if you’re trying to raise it. Your standard pH tells you where you stand. Buffer pH tells you how stubborn the soil will be about moving.
The surprising part: texture changes the math entirely. Soils high in clay or organic matter carry a lot of “stored” acidity, because those particles have far more charged sites holding onto hydrogen ions. That means it takes noticeably more lime to raise the pH of a clay-heavy soil than a sandy one, even when both start at the exact same pH reading. Skip this number and it’s easy to over-lime a clay bed while barely nudging it, or dump way too much onto sand and swing it too far the other direction.
#3 – Your Soil’s Actual Nutrient-Holding “Bank Account”
Most people have never heard the term Cation Exchange Capacity, or CEC. It might be the single most revealing number on the entire report.
CEC measures how well your soil holds onto nutrients instead of letting them wash away. Think of it as a savings account: a high number means fertilizer investments actually stay put; a low number means the money – literally – drains straight through before your plants ever get a taste.
Here’s the number that surprises people: CEC is measured in milliequivalents per 100 grams of soil, and the ideal range sits around 15–20 meq/100g. Anything below 6 meq/100g needs remediation or close monitoring.
Fast Facts
- Sandy soil: typically 1–10 meq/100g
- Silt loam: typically 10–20 meq/100g
- Clay soil: typically 20–50+ meq/100g
- Peat or heavily organic soil: can exceed 100 meq/100g
Sandy coastal soils and heavily tilled urban lots routinely score between 1 and 5 – a garden that will never hold fertilizer, no matter how much you pour on, until the underlying structure gets fixed first.
#4 – Whether Your Soil Can Actually Support Plant Life Long-Term
Organic matter sounds like the most boring line item on the page. Experts argue it’s actually the single best predictor of whether your soil will still be productive a decade from now.
Organic matter percentage is treated as a productivity indicator because it improves water retention, nutrient availability, structure, drainage, and aeration all at once – everything a root system needs to actually spread out and thrive. It’s not just fuel for plants. It’s the infrastructure the whole system runs on.
The uncomfortable truth: this number is brutally slow to change. Soil pH can shift in a season with a bag of limestone. Organic matter takes years of consistent effort. Someone tossing in a single bag of compost and calling it fixed is fooling themselves – and this same reading directly boosts the CEC score from #3, which is exactly why professionals never read the two numbers apart.
#5 – The Cation “Balance Sheet” That Fertilizer Companies Rarely Explain
Base saturation is the number most retail garden centers never bring up, probably because it complicates a simple sales pitch.
It’s essentially a percentage breakdown of what’s occupying the nutrient “parking spots” measured by CEC – calcium, magnesium, potassium, and hydrogen all competing for the same charged sites in the soil.
Here’s the controversial part many agronomists now push back on: the old idea that soil needs one exact textbook ratio of Ca, Mg, and K has real limits. A soil can hit every recommended ratio perfectly and still starve your plants, because a low-CEC sandy soil simply doesn’t have enough total volume of nutrients to go around – balance means nothing without enough in the bank to begin with. That’s exactly why base saturation only means something when it’s read alongside CEC and organic matter, never on its own.
#6 – The Nutrient That Can Quietly Poison Nearby Water
Phosphorus gets treated like an unlimited good – more must be better, right? Actually, this is one of the more controversial readings on the whole report, because too much of it isn’t a bonus. It’s a liability.
When soil test levels already read medium, optimum, or high, adding more phosphorus does nothing for your plants but plenty for the creek down the hill. Eroded soil carries excess phosphorus straight into waterways, and along with nitrogen, it feeds algae blooms – not a hypothetical, but a documented chain reaction that plays out in ponds and streams every summer.
The part that shocks people: when that algae eventually dies off, it triggers eutrophication – a nutrient overload that starves the water of oxygen and kills fish, plants, and everything else living in it. A backyard gardener over-applying phosphorus “just in case” isn’t helping their tomatoes at all. They may be quietly feeding a dead zone three properties away.
Worth Knowing
- Algae blooms fueled by excess phosphorus can turn water green within days
- Oxygen depletion from die-off is a leading cause of summer fish kills
- Runoff risk climbs sharply on sloped or eroding lawns
- Retesting every 2–3 years helps catch phosphorus buildup before it becomes a runoff problem
This is precisely why a lab result, not a guess, should decide whether phosphorus gets added at all.
#7 – Why Your Potassium Number Depends on What You’re Growing, Not Just What’s There
Potassium looks like the simplest number on the page. Misreading it is actually one of the most common mistakes soil labs see.
Potassium moves water and nutrients through the plant, drives enzyme activity, and strengthens stalks and stems. But the raw number printed on your report means almost nothing without context – specifically, what you’re planning to grow and how much of your soil’s CEC “storage space” is actually available to hold it.
Here’s what surprises most people: yield goal is the first thing labs factor into a potassium recommendation, with soil CEC figuring in right after. A reading that looks “high” on a low-CEC sandy plot might read as flat-out deficient for a demanding crop in clay soil. And low-CEC soils carry a separate risk entirely – recommended potassium rates get deliberately lowered on soils with a CEC under 5, because any extra doesn’t stay put. It leaches straight past the root zone and disappears.
#8 – The Nutrient Most Soil Tests Deliberately Leave Out
This one catches almost everyone off guard: standard soil tests routinely skip a full nitrogen reading. It’s not an oversight. It’s intentional.
Nitrogen is famously restless in soil – it shifts constantly with moisture, temperature, and microbial activity, which makes a single snapshot test far less trustworthy than it is for something stable like phosphorus or potassium. A number on a page just can’t keep up with how fast nitrogen moves through the ground.
The insider truth: because nitrogen swings so fast, agronomists lean on tissue tests, pre-season estimates, or in-season monitoring instead of trusting one lab result in isolation. Most home gardeners assume “no nitrogen listed” means “no nitrogen needed.” It usually means the opposite – the lab is telling you this number moves too fast to trust standing alone.
#9 – The Secondary Nutrients That Quietly Control Crop Quality
Calcium, magnesium, and sulfur get filed under “secondary” nutrients, which makes people assume they’re optional. They aren’t.
Sulfur recommendations are calculated from CEC, organic matter, and pH together, and one rule of thumb agronomists actually use is roughly 1 pound of sulfur for every 10 pounds of nitrogen applied, with most crops responding once soil sulfur drops below 25 ppm. That ratio rarely gets mentioned outside agronomy circles, yet it quietly decides whether your nitrogen fertilizer even gets used efficiently by the plant.
Here’s the twist: these secondary nutrients are tangled up with the CEC and pH numbers from earlier. Calcium and magnesium fight for the same charged “parking spots” that CEC measures, so a soil with weak CEC will struggle to hold onto them no matter how much gets applied. Chasing a magnesium deficiency without fixing CEC first is treating the symptom while ignoring the cause.
#10 – The “Minor” Nutrients That Are Anything But Minor

Micronutrients sit at the bottom of most reports in the smallest font on the page, which quietly convinces people they don’t matter. Soil scientists flatly reject that assumption.
Iron, zinc, manganese, boron, and copper are needed in tiny amounts, but a shortage of any one of them is just as capable of capping your yield and quality as a shortage of nitrogen, phosphorus, or potassium. Deficiencies usually show up as strange leaf discoloration or stunted growth – symptoms gardeners routinely misdiagnose as disease or overwatering.
The controversial opinion here: many soil labs argue home gardeners fixate on the “big three” printed in bold on every fertilizer bag while completely ignoring the micronutrient panel, even though a single trace deficiency can bottleneck an otherwise perfectly fed, perfectly watered plant. It’s a classic case of chasing the obvious numbers while ignoring the ones that actually explain the mystery symptoms.
#11 – Whether Your Own Backyard Is Safe to Eat From
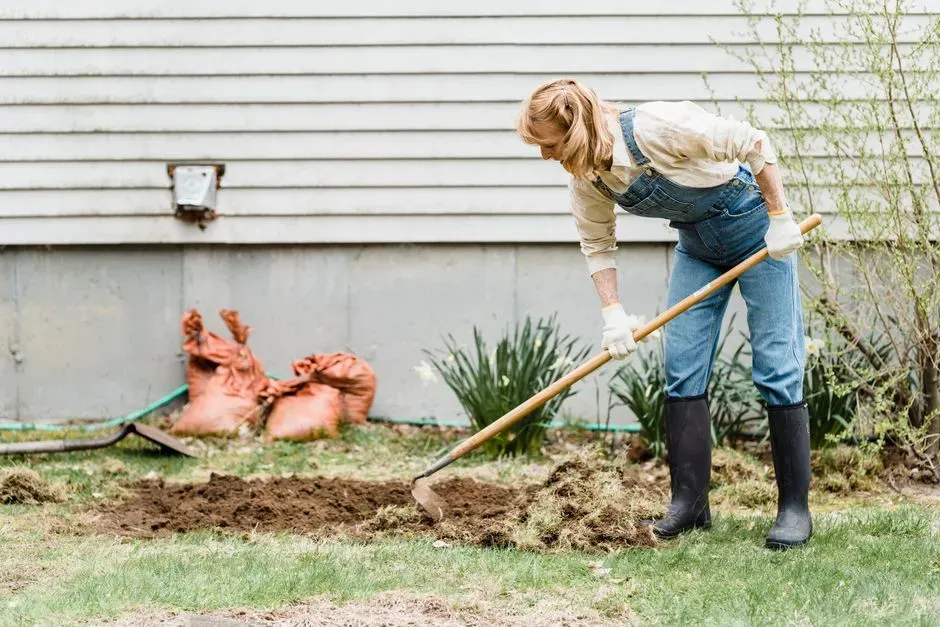
This is the finding that changes how people think about soil testing entirely, because it isn’t about plant nutrition at all. It’s about human safety.
Heavy metals – lead, copper, arsenic, cadmium – can be toxic to humans and plants alike when they build up in high enough concentrations, and soil is often the final landing spot for decades of industrial and agricultural pollution. Most people never think to ask their soil test to check for this. They assume “soil test” only ever means fertilizer advice.
The number that should worry city dwellers specifically: lead occurs naturally in all soils at roughly 15 to 40 parts per million, but pollution can push that into the thousands. The primary culprit is disturbingly mundane – weathering, chipping, scraping, sanding, or sandblasting structures with old lead-based paint. Anyone gardening near an older home should take this seriously; a result above 150 mg/kg means action is needed before anything new goes in the ground.
At a Glance: Lead in Soil
- Natural background level in most soils: 15–40 ppm
- Classic EPA hazard standard: 400 ppm in play areas, 1,200 ppm in the rest of the yard
- Updated 2024 EPA screening guidance: 200 ppm generally, 100 ppm near other lead sources like old paint or lead pipes
- Former industrial or smelter sites: can exceed 10,000 ppm
Soil that looks perfectly healthy on the surface can still be hiding decades of contamination underneath – the only way to know is to test it.
U.S. Environmental Protection Agency, on urban soil lead risk
Here’s the part that actually offers some relief: pH plays a controlling role here too. Lead uptake stays low when soil pH is kept closer to neutral, because the metal gets chemically locked up and immobilized. And contamination doesn’t automatically mean game over – growing leafy and root vegetables in raised beds filled with clean soil, and covering bare ground with a thick layer of mulch, both meaningfully cut exposure. Most standard tests skip the heavy metal panel entirely unless you specifically request it, which means an untold number of backyard gardens are being farmed right now without anyone ever checking. If you garden in a city, near a school, or in a shared community plot, this is the one line item worth paying extra for – because soil contamination can vary wildly from one corner of a yard to the next, and without a test, you’re gardening blind.
The Bottom Line

A soil test was never a single number. It’s eleven separate stories stacked on top of each other, and most people only ever bother to read one.
The pH line gets all the attention while CEC, base saturation, and the heavy metal panel sit ignored in the margins, even though they usually explain the exact problem a gardener has been quietly fighting for years. The most useful numbers on the whole page – buffer pH, organic matter trends, lead content – are almost always the ones nobody thinks to ask about, and they’re usually sitting there for the same test fee you already paid.
If there’s one opinion worth stating plainly: skipping the heavy metal panel on urban soil isn’t cautious frugality. It’s a real gamble with a kid’s health, dressed up as a shortcut. Which one of these eleven surprised you the most? Drop it in the comments.