Most people assume grizzly bear science is a straight line – a bear gets counted, a paper gets published, and that number becomes gospel forever. Dig into the actual research record, though, and a much messier picture emerges: population figures that quietly doubled, “settled” diet studies that got rewritten from scratch, and at least one landmark paper that had to be pulled entirely after a researcher was caught fabricating data.
Wildlife biology, it turns out, revises itself constantly – and almost never with a press release. Some of these reversals took a lawsuit to surface. Others took a second field season, a corrected statistical model, or a whistleblower inside a pharmaceutical company. Here’s what the research record actually shows, starting with a “stable” population that wasn’t nearly as stable as its own headline number claimed.
#13 – The Denali “Stable Population” Claim That Wasn’t So Stable
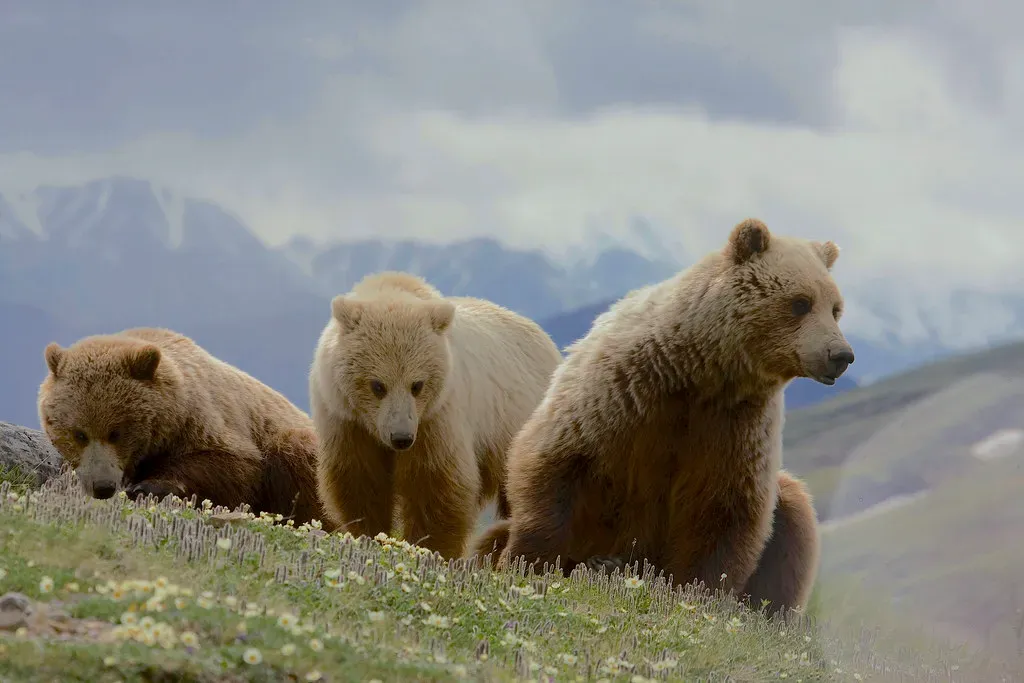
For years, one of North America’s longest-running grizzly studies quietly walked back its own confidence in a “stable” population trend.
Denali National Park has one of the longest continuous grizzly bear population studies in the world, and researchers there calculated a population trend estimate they described as generally stable. But when they ran the actual probability math, the picture wasn’t nearly as reassuring as the headline number suggested. Their estimate of population trend in Denali suggested a generally stable population with a mean lambda of 0.9963 – but within the bounds of probability, there was a greater likelihood that the population was decreasing at a maximum rate of approximately 3.8% annually than that it was growing.
That’s a massive caveat to bury in a technical appendix. A “stable” population headline that actually leans toward decline is exactly the kind of nuance that gets dropped when the finding gets repeated in later summaries. Researchers even noted a stable to decreasing population was likely given the low survival of cubs and yearlings, a detail that rarely makes it into the simplified version. But that’s nothing compared to what we found about #12…
#12 – The Banff Bear Count That Nearly Halved in Two Years
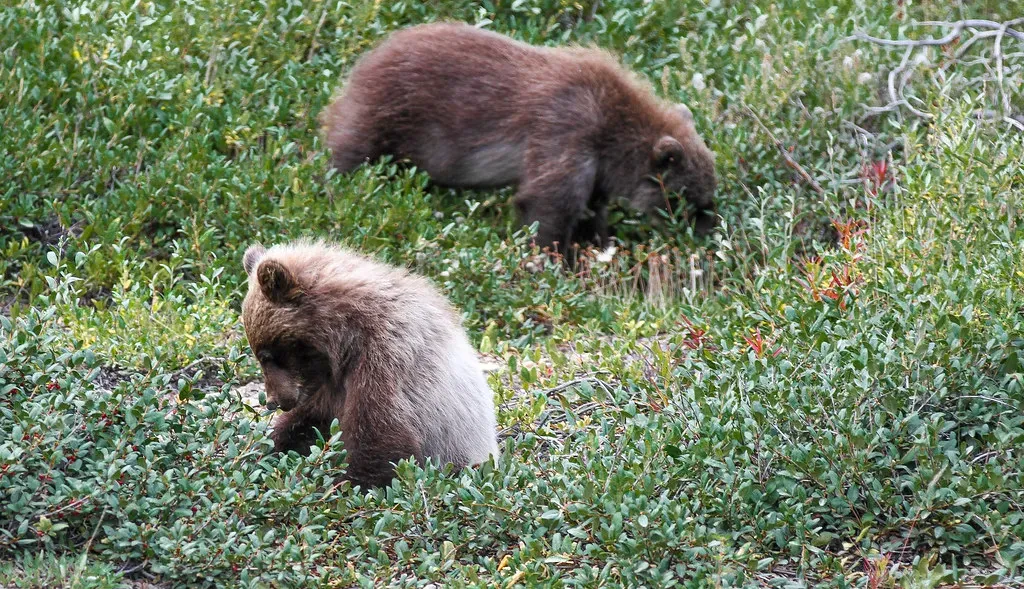
Nothing rattles confidence in a population number quite like watching it swing wildly from one field season to the next.
In Banff National Park, researchers used DNA-based mark-recapture models to generate what they called the first precise abundance estimates for local grizzlies. The numbers should have told a consistent story. Instead, they obtained an estimate of 73.5 grizzly bears (95% CI = 64–94) in 2006, and just 50.4 (95% CI = 49–59) in 2008 – a drop of roughly a third in only two years, in a population too slow-reproducing to lose that many animals naturally.
The likelier explanation isn’t a bear die-off – it’s detection uncertainty getting mistaken for a real population crash. Later work on the same ecosystem confirmed the combination of low densities, low reproductive rates, and predominantly negative population growth rates suggest that Banff National Park’s grizzly bear population requires continued conservation-oriented management. Early headline numbers rarely survive contact with a second field season. But #11 shows how deep this modeling problem actually runs.
#11 – The Statistical Model That Quietly Got a Correction Notice

Even peer-reviewed, published grizzly research isn’t immune to needing a formal fix after the fact.
A 2015 study comparing two statistical approaches to counting Banff grizzlies – non-spatial versus spatial capture-recapture models – found the older method was systematically skewed. The two models produced similar estimates of apparent survival and recruitment, but the spatial capture-recapture models had better fit, and non-spatial models produced negatively biased estimates of apparent survival and positively biased estimates of per capita recruitment. In plain terms: the standard method was underselling bear deaths and overselling bear births.
That’s the opposite of a rounding error – it’s a bias that could make a shrinking population look like it’s holding steady. The paper itself later needed patching: there were errors in the supplementary material that had to be corrected and reissued. Quiet fixes like this rarely reach the public summary. Wait until you see how this plays out with the actual DNA sampling technique itself in #10.
#10 – The DNA Hair-Snag Method That Missed Up to 95% of Bears
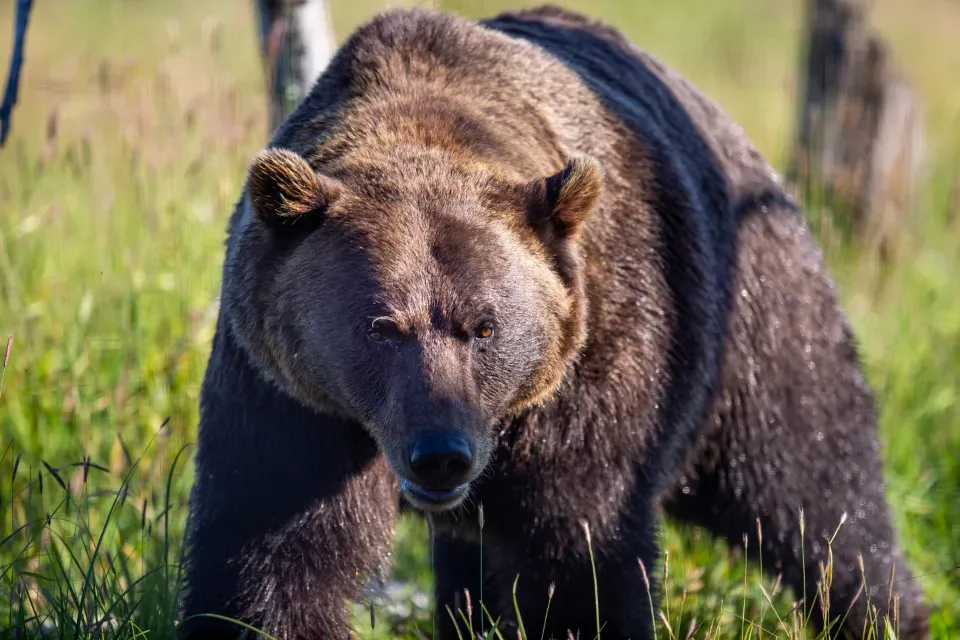
The gold-standard, non-invasive way to count grizzlies has a blind spot most casual readers never hear about.
Wildlife agencies rely heavily on hair-trap DNA sampling to estimate how many bears occupy a given landscape – it’s cheaper and less invasive than trapping bears directly. But when researchers compared hair traps against camera traps watching the same sites, the hair method badly underperformed. Noninvasive genetic tagging via hair trapping consistently underestimated grizzly bear occupancy at a site compared to camera trapping – at best occupancy was underestimated by 50%, at worst by 95%.
Quick Compare
- Hair-trap only: missed anywhere from 50% to 95% of confirmed bear activity at a site
- Camera trap: caught visits that hair snags failed to register entirely
- Best-case gap: hair-trap counts undercounted occupancy by half
- Worst-case gap: hair-trap counts missed nearly all the bears actually present
That’s not a footnote – that’s a management tool potentially missing nearly all the bears actually present. The same research team recommended hair-trap studies should estimate and correct detection error using independent survey methods such as cameras, to ensure the reliability of the data upon which species management and conservation actions are based. Decades of density estimates built on hair snags alone deserve a second look. But #9 involves a courtroom, not a lab.
#9 – The “Non-Issue” Claim a Federal Court Said Contradicted the Science
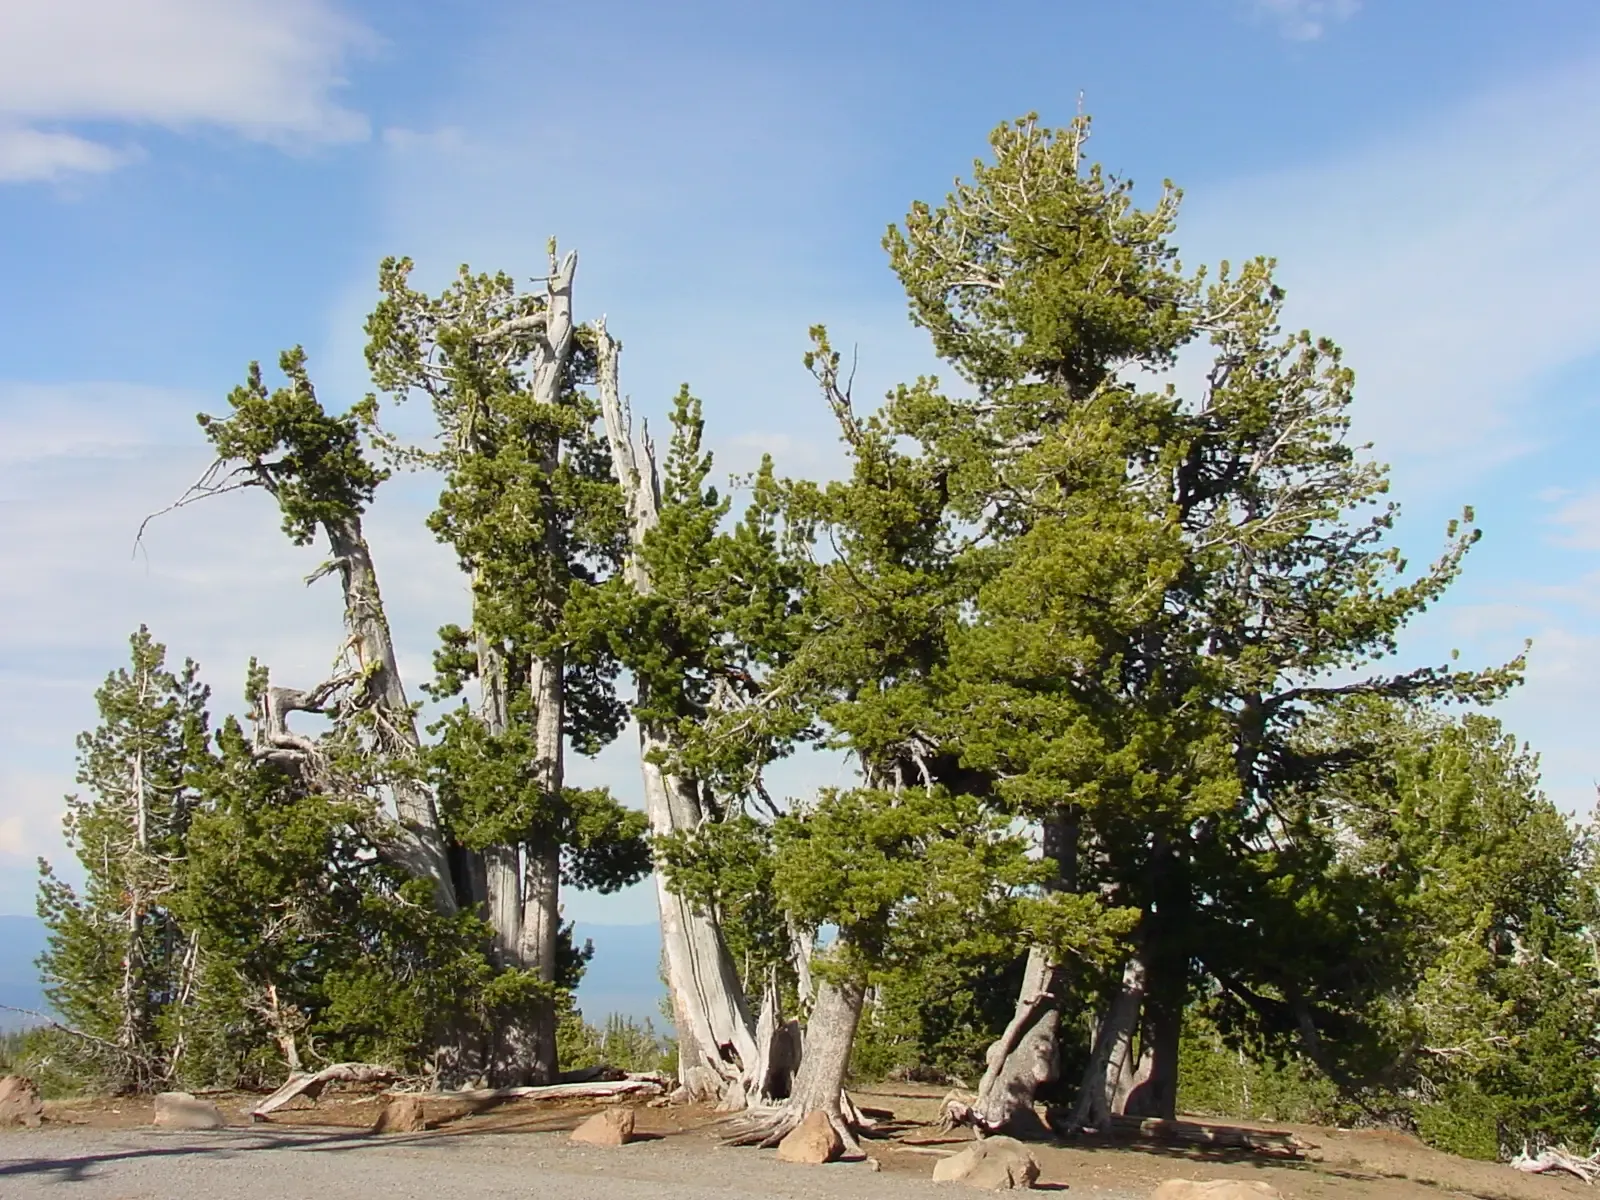
Sometimes a finding doesn’t get removed by researchers – it gets removed by a judge who actually read the citations.
When the U.S. Fish and Wildlife Service tried delisting Yellowstone grizzlies, it argued that the decline of whitebark pine – a key seasonal food source – was a “non-issue” for bear survival. A federal court disagreed, and did so using the agency’s own sources. The District Court agreed with plaintiffs that the Service had failed to support its conclusion that isolation of the Greater Yellowstone population was a “non-issue,” noting that the two studies relied on by the Service supported the opposite conclusion.
That’s about as close as wildlife science gets to a public retraction – a finding invalidated in a legal ruling rather than a journal errata page. The court concluded that “much of the cited science directly contradicts” the Service’s position on whitebark pine’s importance. An agency’s own studies were quietly working against its conclusion. Slide #8 digs into exactly what the science on that isolation risk actually said.
#8 – The Genetic Isolation Risk That Kept Getting Downplayed, Then Reinstated
For years, agencies managing the Yellowstone grizzly treated genetic isolation as a manageable footnote. Later courts – and later science – disagreed sharply.
When the delisting rule dropped a requirement to translocate bears between fragmented populations to maintain genetic diversity, courts pushed back hard. A federal court in Montana overturned the delisting of the grizzly bear in 2018, ruling that although the Greater Yellowstone Ecosystem population had recovered, the overall recovery of grizzlies throughout the Rocky Mountains was not guaranteed. Connectivity between populations, once treated as a minor detail, became the central issue.
Concerns were raised in court about connectivity between the Greater Yellowstone population and other grizzly populations, which is crucial for genetic diversity – and until those issues were addressed, the court determined the grizzly bear should remain listed. A finding agencies had effectively shelved got forced back into the official record by litigation, not new fieldwork. That legal back-and-forth over “recovery” numbers connects directly to slide #7’s population math controversy.
#7 – The 4%-a-Year Growth Rate Now Called Statistically Unreliable
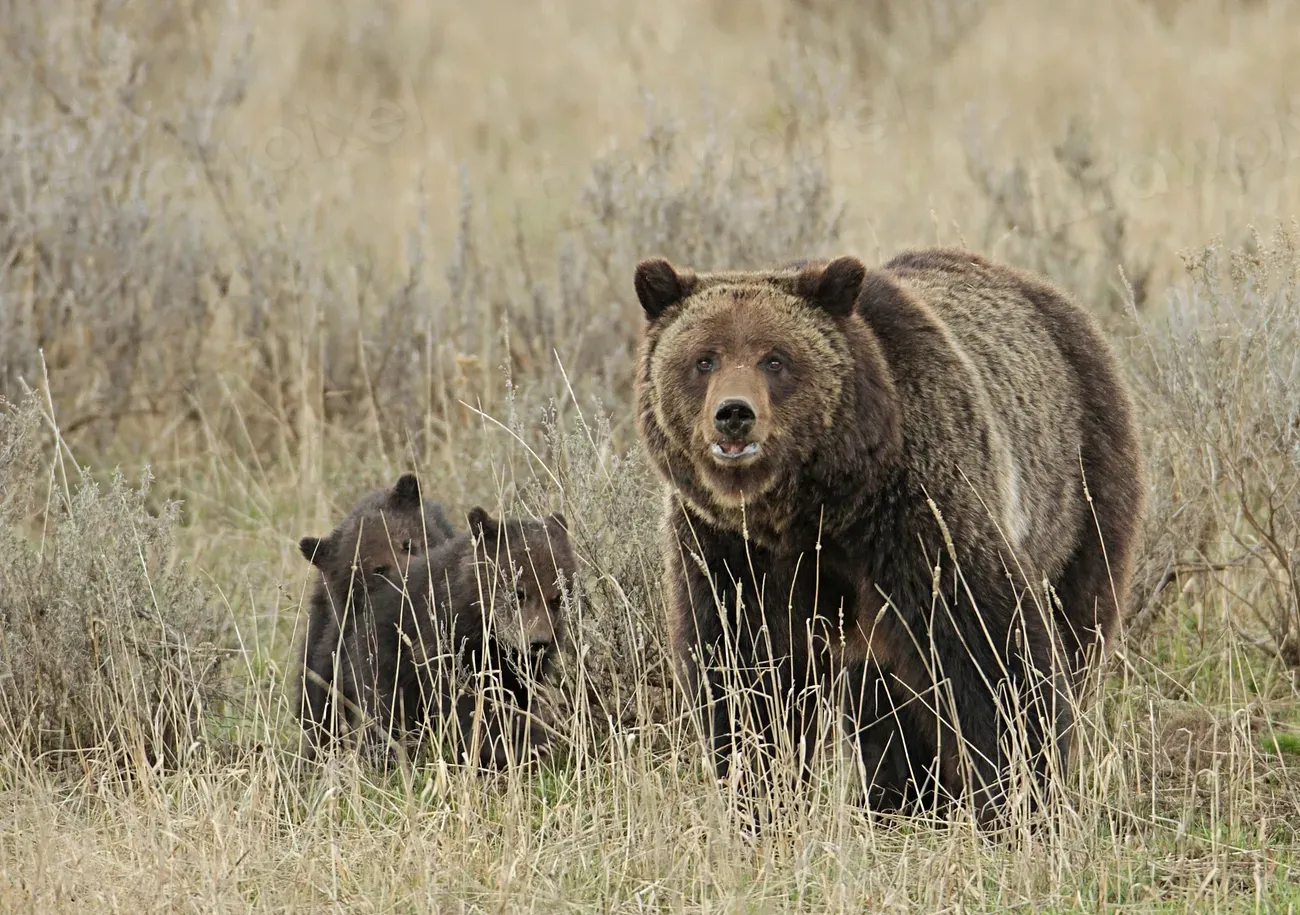
For nearly two decades, one number anchored almost every grizzly recovery argument in Yellowstone – and it’s now under serious question.
Advocacy groups and agencies alike repeated a familiar figure: the Yellowstone grizzly population grew roughly 4% annually from 1983 to 2001. That statistic underpinned delisting arguments for years. But recent research has suggested that methods for estimating that trend are unreliable and biased high, meaning the celebrated growth rate may have been inflated from the start.
At a Glance
- Claimed growth rate: roughly 4% per year, 1983-2001
- Problem uncovered: the estimation method was found to be biased high
- Revised trajectory: growth appears to have stalled around 2002
- Possible reality: the population may have been declining since 2008
Even accepting the newer, more conservative methodology, the story shifts substantially. Even taking current methods at face value, population growth appears to have stalled around 2002, with the possibility of declines since 2008 – especially likely given the optimistic bias of current methods. A two-decade “success story” statistic quietly became a much murkier maybe. That same measurement problem gets even stranger in slide #6, where the undercounting was reportedly intentional.
#6 – The Population Count That Was “Underestimated By Design”
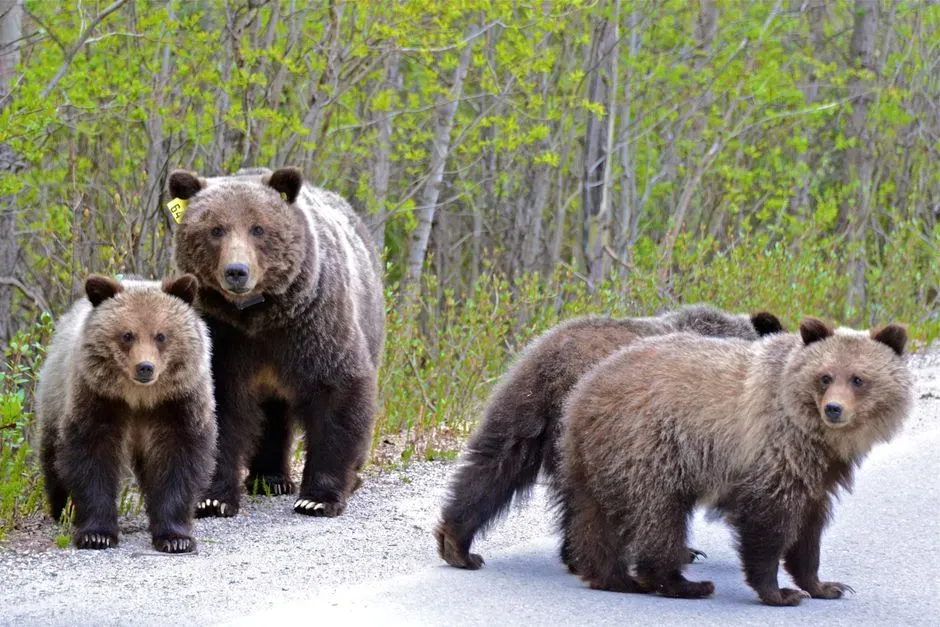
Here’s a finding that didn’t just fade from later papers – the study team leading the research openly admitted the original method was built to lowball the number.
For years, the official Greater Yellowstone grizzly population estimate hovered in the 600–750 range. Then the team running the count admitted the whole approach had a built-in conservative bias. It was a recovering population that officials didn’t want to overestimate, and so by design, the method ended up underestimating the population – something shown in a study team publication back in 2008.
That’s a remarkable admission: a scientific methodology deliberately engineered to undercount, for policy reasons, not biological ones. The mechanism was buried in the fine print – the female-with-cubs count relied on a 30-kilometer separation criterion that was too conservative to separate observations into the unique family clusters they actually belonged to. Fixing that single distance rule triggered the dramatic number in slide #5.
#5 – The Overnight Jump From 700 Bears to Over 1,000
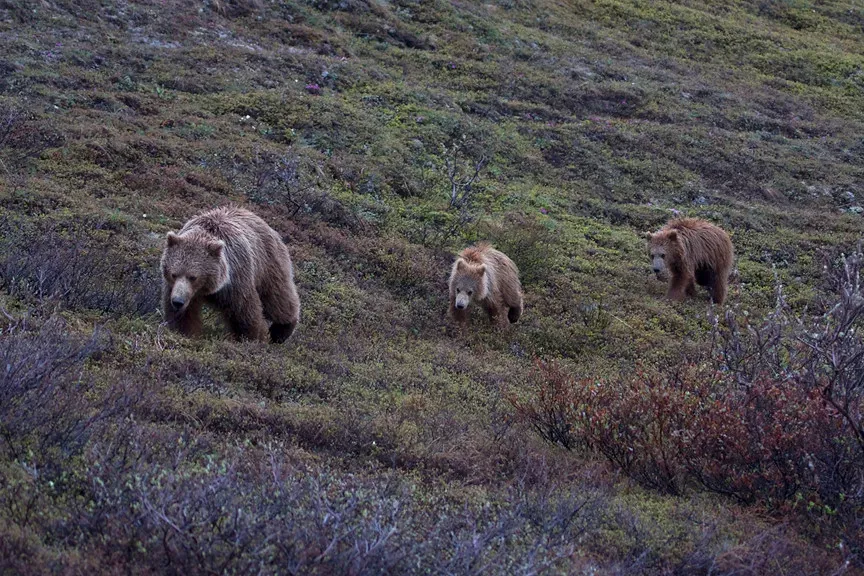
When agencies finally corrected the undercounting problem from slide #6, the new number didn’t creep up gradually – it jumped by hundreds of bears almost overnight.
The Greater Yellowstone Ecosystem grizzly bear population was estimated at almost 1,070 bears – much higher than the previous estimate of around 750. That’s not incremental correction; that’s a population figure ballooning by more than 40% purely from a math and methodology change, with the actual bear population presumably having moved far less than that.
Fast Facts
- Old estimate: around 750 bears, using a 30-kilometer separation rule
- New estimate: almost 1,070 bears, using a 16-kilometer separation rule
- Jump size: more than 40% higher, from one methodology change alone
- Real-world cause: a corrected distance criterion, not a sudden baby boom
The fix itself was almost embarrassingly simple. Researchers decreased the distance criteria between bear-family clusters from 30 to 16 kilometers for a better estimate – the first year using the new approach, and it appeared far more accurate to conditions on the ground. A single distance parameter had been suppressing the “official” bear population for well over a decade. Slide #4 shows a completely different kind of quiet reversal – this one about what grizzlies actually eat.
#4 – The Cutthroat Trout Collapse That Rewrote the Yellowstone Diet Story
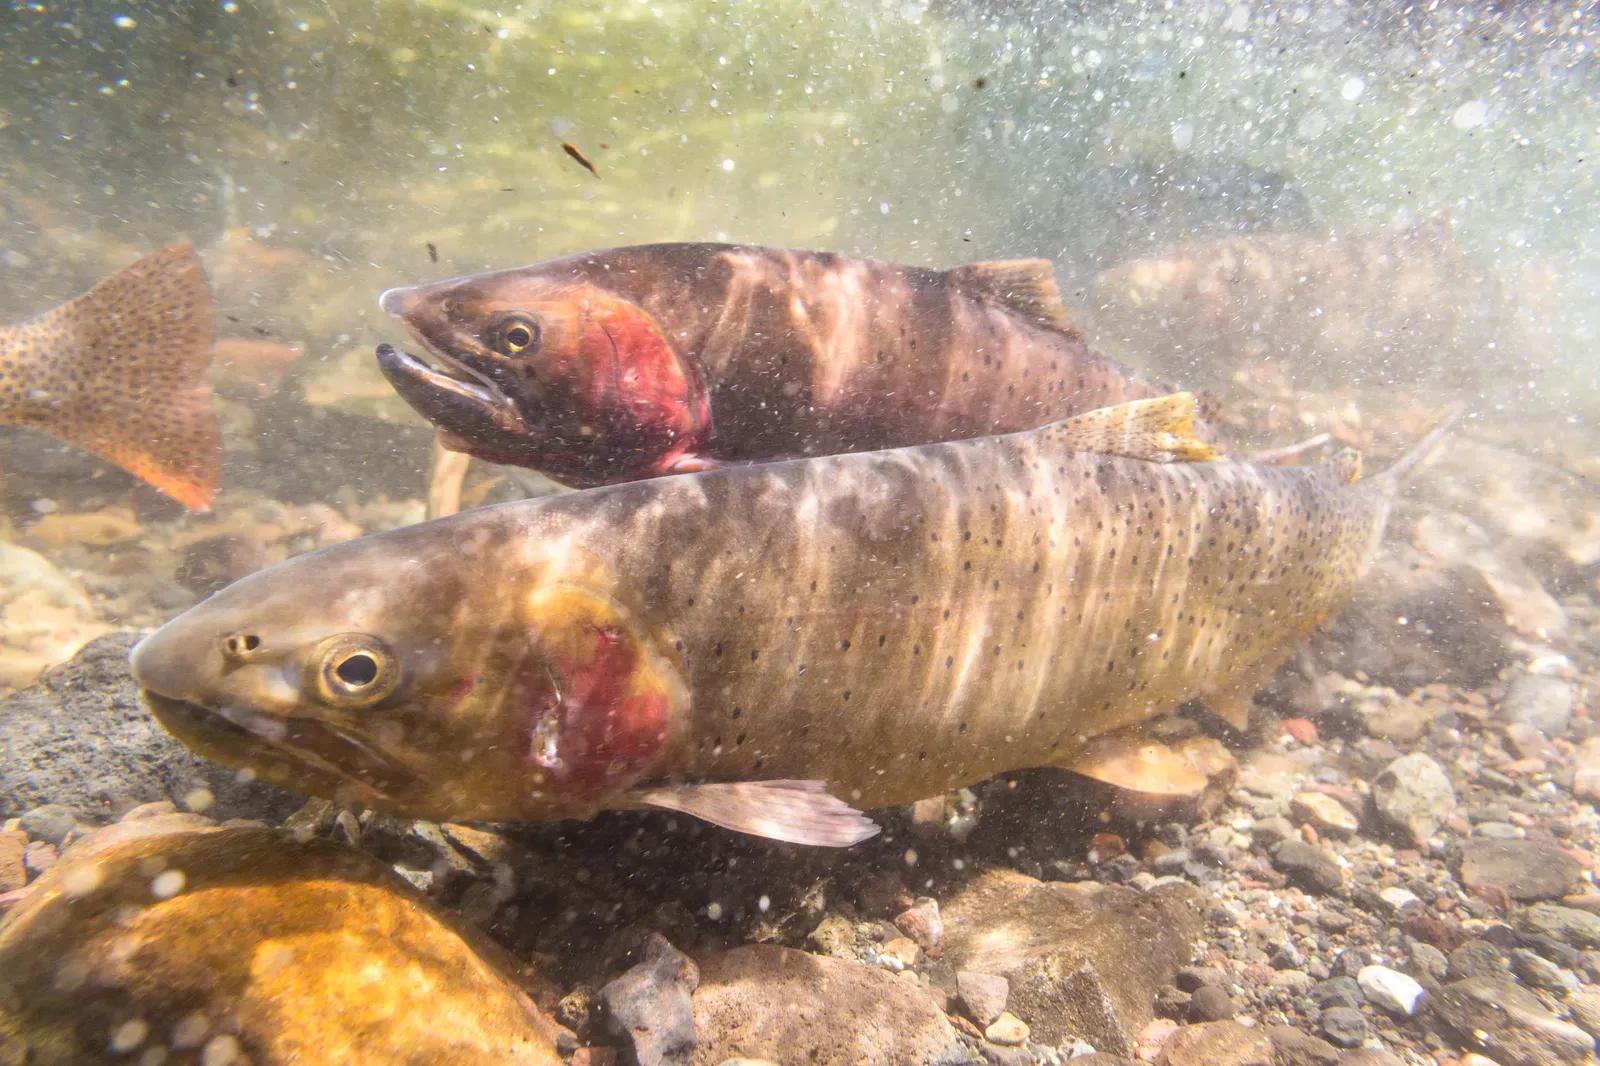
Grizzly diet research used to treat certain foods as dependable staples. Then the fish practically disappeared, and researchers had to scramble to rewrite the assumptions.
Cutthroat trout were once one of the most reliable protein sources for Yellowstone grizzlies near spawning streams. That changed fast once invasive lake trout and disease hit the fishery. The estimated biomass of cutthroat trout consumed by grizzly bears and black bears declined 70% and 95%, respectively, in the decade between 1997–2000 and 2007–2009.
The scale of collapse behind that number is staggering – one stream feeding Yellowstone Lake once had over 70,000 spawning cutthroat trout, and now there are only 500. A food source once treated as a near-permanent fixture of bear ecology essentially vanished within a generation. Bears compensated by leaning harder on elk calves – a shift that sets up an even bigger dietary rewrite in slide #3.
#3 – The “Bears Are Starving Without Pine Nuts” Narrative That Got Quietly Softened
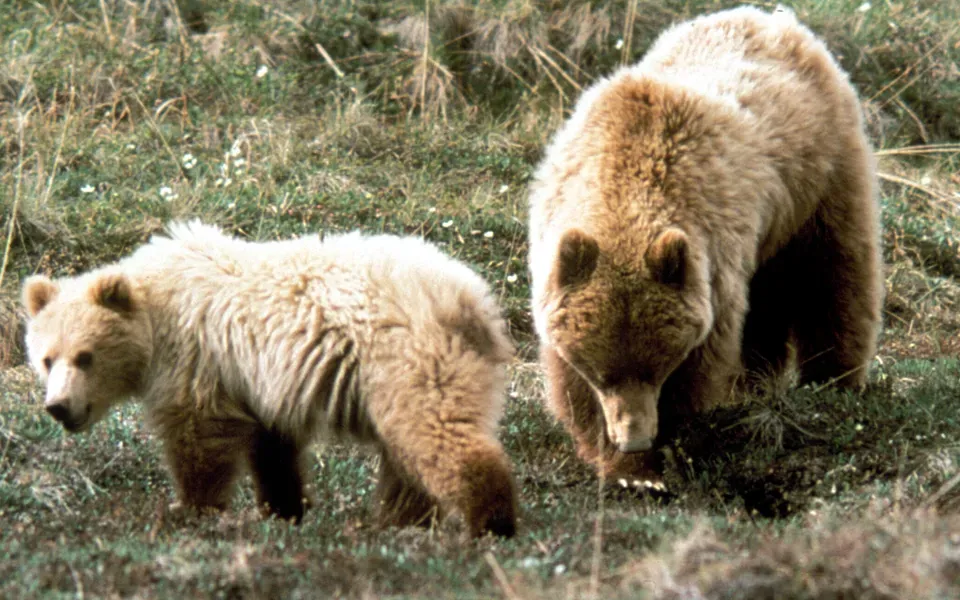
For years, conservation messaging treated whitebark pine decline as an existential threat pushing grizzlies toward extinction. Newer isotope-based diet studies tell a more complicated story.
Whitebark pine forests suffered dramatic losses from blister rust, pine beetles, and fire, and early narratives predicted that grizzlies would suffer directly and severely from the loss of this high-calorie food. But later stable-isotope research found something more nuanced: estimates from the top diet model suggested whitebark pine seeds (35±10%) and other plant foods (56±10%) were actually more important than meat (9±8%) to grizzly bears sampled in the study area – showing bears leaning heavily on plants generally, not collapsing without one specific nut.
Worth Knowing
- Whitebark pine seeds: roughly 35% of diet share when nut crops are abundant
- Other plant foods: roughly 56% of diet share – the real dietary heavyweight
- Meat overall: just around 9% of the sampled diet
- Backup plan: false-truffles replace pine nuts in the diet during lean nut years
Researchers also found whitebark pine nuts continue to be a primary food source when abundant, but get replaced by false-truffles in the diets of female grizzlies and black bears when nut crops are minimal. The “bears can’t survive without pine nuts” framing quietly gave way to a “bears are remarkably flexible eaters” framing. Slide #2 involves an even older narrative reversal – this one about whether grizzlies belong in national parks at all.
#2 – The “Problem Bear” Narrative That Got Flipped by a 2013 Study
Decades of grizzly management were shaped by the assumption that national parks and human recreation were fundamentally incompatible with bear survival. A landmark study quietly undercut that entire premise.
Earlier researchers and commentators argued that national parks essentially trapped grizzlies in dangerous proximity to people, fueling conflict and mortality. But a 2013 study from ecologists and bear management specialists at Yellowstone reversed that framing directly. Contrary to earlier claims, researchers found the national parks are actually “critical to the survival and recovery of grizzly bears,” and confirmed that “bears avoid humans even when humans are confined within predictable locations such as campsites.”
Coexistence, once treated as a fringe theory, became the data-backed consensus. This is exactly the kind of finding that gets buried under the louder, older narrative it replaced – most casual readers still repeat the outdated “bears and parks don’t mix” line. And slide #1 is the most dramatic reversal on this entire list, because it wasn’t a reinterpretation. It was outright fraud.
#1 – The Landmark Hibernation Study Pulled After a Researcher Faked the Data
This is the one that should worry anyone who assumes peer review catches everything: a headline-grabbing grizzly bear study had to be retracted because a scientist simply made up results.
In 2014, a team including researchers from Amgen, the University of Idaho, and Washington State University published a widely covered study in Cell on how grizzlies avoid long-term metabolic damage from massive weight gain and inactivity during hibernation. The findings looked remarkable – until the truth came out. Authors retracted the paper on grizzlies’ metabolism after finding one person had made up data, admitting the misconduct and pulling the 2014 Cell study.
“We know data were actually manipulated, and that just cannot stand.”
Amgen Research Chief, to The Wall Street Journal
The underlying biological claim – that insulin sensitivity reversed course seasonally, with intact signaling in fall, insulin resistance during hibernation, and a return to normal by spring – may or may not hold up under honest data. A study that seemed to unlock secrets for treating human diabetes and osteoporosis had to be pulled entirely, and the “offending author” was never publicly named. That’s the single most damning example of a finding removed after publication – not softened, not reframed, but erased.
The Bottom Line
Grizzly bear science isn’t broken – it’s self-correcting, which is exactly how good research is supposed to work. But the pattern across these 13 cases is impossible to ignore: population counts admitted to be deliberately conservative, diet narratives that flipped once better isotope tools arrived, and one flagship metabolism study that turned out to rest on fabricated data.
The public rarely hears about the walk-backs – only the original headline, printed once and repeated forever. If you’ve ever repeated a “settled” grizzly fact from a decade-old article, there’s a real chance it’s already been quietly revised, corrected, or reversed in court. Science didn’t fail here – the headlines did.