Dinosaur growth charts have become essential tools for paleontologists trying to understand how these magnificent creatures developed from hatchlings to adults. These visual representations track the estimated size, weight, and morphological changes of dinosaurs throughout their lifespans. While they appear authoritative in museums and textbooks, the accuracy of these growth charts varies significantly based on available fossil evidence, analytical methods, and ongoing scientific discoveries. As our understanding of dinosaur biology continues to evolve, so too does the precision of these developmental timelines. This article explores the science behind dinosaur growth charts, examining their limitations, strengths, and the fascinating insights they provide into prehistoric life.
The Fossil Record: An Incomplete Picture
The accuracy of dinosaur growth charts fundamentally depends on the completeness of the fossil record, which is inherently fragmentary. Paleontologists rarely discover complete growth series—fossils of the same species at different developmental stages—making it challenging to chart precise growth trajectories. For popular species like Tyrannosaurus rex, scientists might have fossils representing juveniles, sub-adults, and mature specimens, but significant gaps often exist between these stages. The preservation bias further complicates matters, as smaller, more delicate juvenile bones preserve less frequently than robust adult remains. This sampling issue creates particular uncertainty around early growth phases, where paleontologists must sometimes extrapolate based on limited evidence or comparative anatomy with related species.
Bone Histology: Reading Growth Rings
One of the most reliable methods for determining dinosaur growth patterns comes from studying bone microstructure through histology—essentially examining thin sections of fossilized bones under microscopes. Much like tree rings, many dinosaurs formed annual growth marks called lines of arrested growth (LAGs) in their bones, providing crucial data about age and growth rates. These microscopic features allow paleontologists to determine how quickly dinosaurs grew and when they reached skeletal maturity. The technique has revolutionized growth chart accuracy, particularly for species like Maiasaura and Allosaurus, where multiple specimens with well-preserved bone tissue have been studied. However, histological analysis requires destructive sampling of valuable fossils, meaning it cannot be performed on all specimens, and interpretation of growth lines sometimes varies among researchers.
Growth Rate Variability Among Species
Dinosaur growth charts must account for the tremendous diversity in growth strategies across different dinosaur lineages, which significantly impacts their accuracy. Studies indicate that some dinosaurs, particularly large sauropods like Apatosaurus, experienced rapid, almost continuous growth similar to modern birds, potentially reaching adult size within a few decades despite their enormous proportions. In contrast, other dinosaurs appear to have grown more slowly, like many modern reptiles, taking many years to reach maturity. The accuracy of growth charts varies considerably between taxa—better-understood species with extensive fossil records produce more reliable growth models than those known from just a few specimens. This biological variation means that growth patterns cannot simply be extrapolated from one dinosaur group to another without substantial supporting evidence.
Sexual Dimorphism and Individual Variation
The accuracy of dinosaur growth charts is complicated by uncertainty regarding sexual dimorphism—physical differences between males and females—and individual variation within species. In some dinosaur taxa, what paleontologists initially interpreted as growth-related size differences might represent sexual dimorphism, as seen in the debate surrounding Tyrannosaurus specimens. Natural variation between individuals, influenced by factors like genetics, diet, and environmental conditions, also creates substantial challenges for creating standardized growth charts. Without large sample sizes, it becomes difficult to distinguish normal variation from actual growth patterns. Most dinosaur species are known from relatively few specimens, making it nearly impossible to account for these variables with statistical confidence in many growth reconstructions.
Modern Analogues: Birds and Reptiles
To improve accuracy, dinosaur growth charts often incorporate data from living relatives—primarily birds and crocodilians—to fill gaps in the fossil record. As the direct descendants of theropod dinosaurs, birds provide especially valuable growth models for understanding certain dinosaur lineages. For instance, the rapid growth and determinate growth pattern (growing to a set size then stopping) observed in modern birds has informed models of growth in small theropods and early birds like Archaeopteryx. Similarly, crocodilian growth patterns offer insights for more basal archosaur lineages. However, this comparative approach has limitations, as modern animals have evolved over millions of years since the Mesozoic era. The environmental conditions, predation pressures, and ecological niches that shaped dinosaur growth strategies were often dramatically different from those facing their modern relatives.
Technological Advances Improving Accuracy

Recent technological innovations have dramatically enhanced the accuracy of dinosaur growth charts. Advanced imaging techniques like computed tomography (CT) scanning allow researchers to examine internal bone structures without damaging specimens. Synchrotron microtomography provides even higher-resolution images of bone microstructure, revealing growth patterns previously invisible to researchers. Sophisticated statistical methods and mathematical growth models now help paleontologists interpolate between known growth stages with greater confidence. Computer modeling can simulate biomechanical constraints on dinosaur growth, ensuring that reconstructions at various life stages are physically plausible. These technological advances have particularly improved our understanding of theropod and ornithischian dinosaur growth, where multiple specimens across different growth stages have been subjected to these analytical techniques.
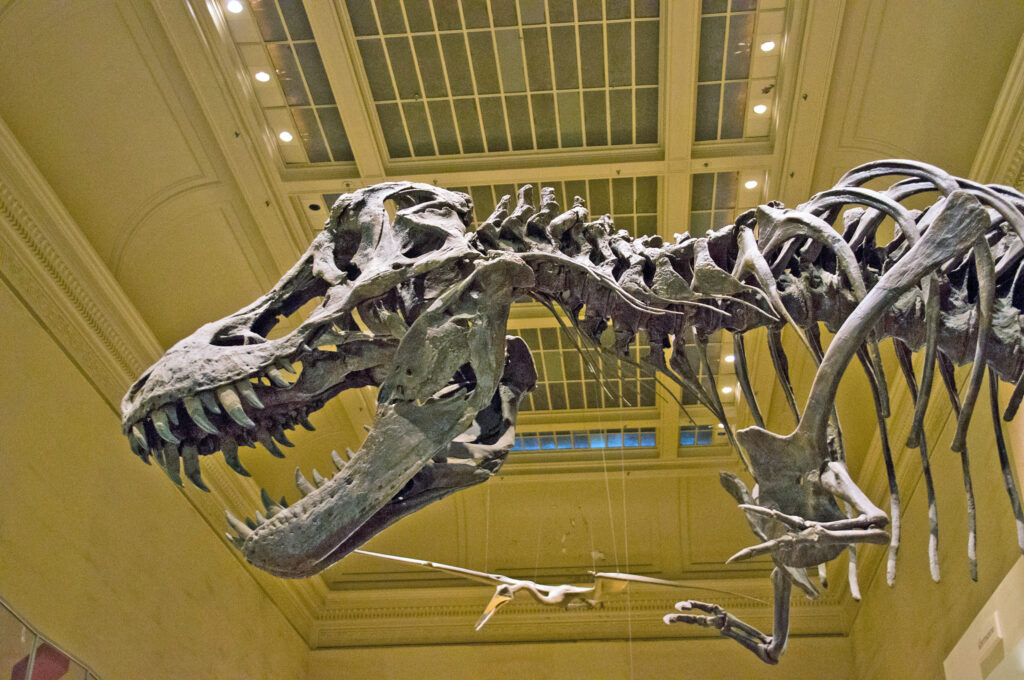
Case Study: Tyrannosaurus rex Growth
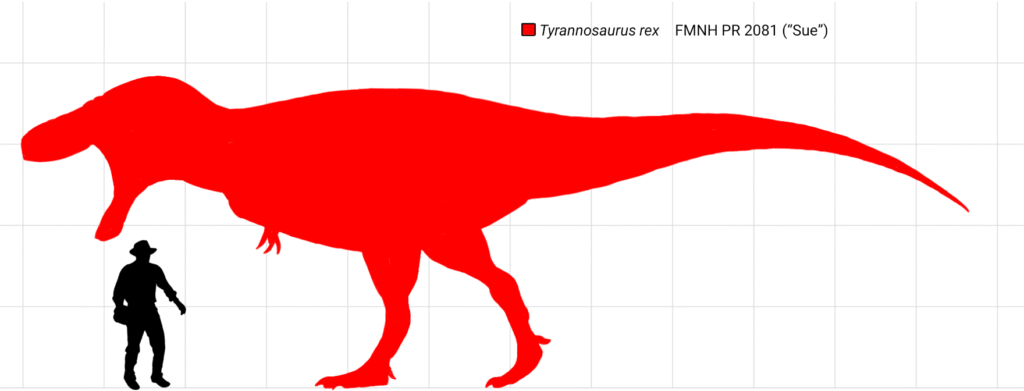
The growth trajectory of Tyrannosaurus rex represents both the potential and limitations of dinosaur growth charts. Thanks to relatively abundant fossil material spanning different age groups—from juveniles like “Jane” to massive adults like “Sue”—paleontologists have constructed a reasonably detailed growth curve for this iconic predator. Histological studies suggest T. rex experienced an extraordinary adolescent growth spurt, gaining up to 2 kg per day during its teenage years before slowing dramatically as it approached skeletal maturity around age 20. However, significant debates persist about the early years and very late stages of T. rex development. The scarcity of very young T. rex specimens leaves uncertainty about hatchling size and early growth rates, while disagreements continue about whether apparent differences among adult specimens represent individual variation, sexual dimorphism, or even separate species. These ongoing debates highlight how even for the best-studied dinosaurs, growth charts contain elements of scientific inference and uncertainty.
Sauropod Growth Puzzles
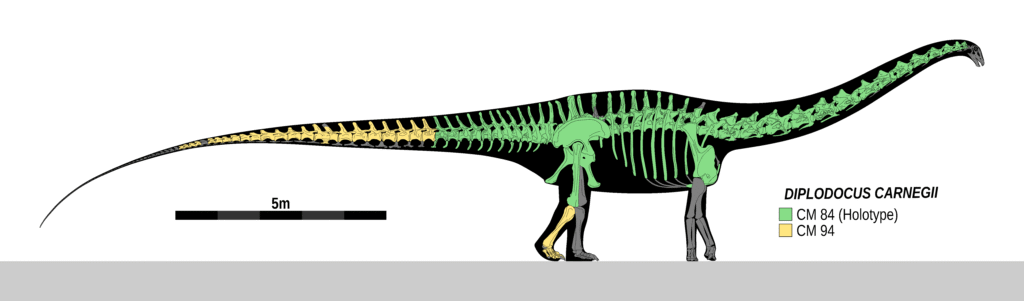
Sauropod dinosaurs present unique challenges for accurate growth charting due to their extraordinary size and relatively limited juvenile fossil record. These massive herbivores likely hatched from eggs roughly the size of footballs yet grew to become the largest land animals that ever lived, reaching weights of 70 tons or more in some species. Histological studies of sauropod bones indicate surprisingly rapid and sustained growth rates, suggesting some species may have reached adult size within a few decades despite their enormous proportions. However, the transition from tiny hatchling to massive adult remains poorly documented in the fossil record for most sauropod species. The physical constraints on such dramatic size increases have led to considerable speculation about growth trajectories, with some researchers suggesting potential changes in body proportions, locomotion, and feeding strategies at different life stages. Without more complete growth series, sauropod growth charts rely heavily on theoretical scaling principles and comparisons with other dinosaur groups.
Environmental Influences on Growth
The accuracy of dinosaur growth charts is further complicated by our limited understanding of how environmental factors influenced dinosaur development. Modern animals often display significant growth plasticity in response to food availability, temperature, population density, and other environmental variables. Evidence suggests dinosaurs likely exhibited similar responses, with growth rates potentially fluctuating seasonally or during environmental stresses. Climate variations across the Mesozoic era and different geographical regions almost certainly affected dinosaur growth patterns. Some dinosaur bones show stress lines indicating periods of slowed growth, possibly corresponding to seasonal resource scarcity. However, most growth charts present idealized trajectories rather than accounting for these environmental variables, partly because identifying their specific effects in the fossil record is extremely challenging. This environmental context remains one of the most significant limitations in creating truly accurate dinosaur growth reconstructions.
Popular Misconceptions in Dinosaur Growth Charts
Public representations of dinosaur growth often perpetuate misconceptions that professional paleontologists would consider inaccurate or oversimplified. Many popular charts depict smooth, continuous growth curves when actual dinosaur growth was likely more complex and episodic. Another common inaccuracy involves the portrayal of juvenile dinosaurs as simply miniature versions of adults, when many species underwent significant changes in body proportions, feature development, and possibly even ecological niches as they matured. Some educational materials fail to communicate the uncertainty inherent in growth reconstructions, presenting hypothetical developmental stages as definitively established. Museums and textbooks sometimes continue displaying outdated growth charts that don’t incorporate recent discoveries, such as evidence that many theropod dinosaurs possessed feathers from early developmental stages. These simplifications, while sometimes necessary for public communication, can create misleading impressions about the precision of our knowledge regarding dinosaur ontogeny.
The Importance of Sample Size
The statistical reliability of dinosaur growth charts correlates directly with the number of specimens available for study, making sample size perhaps the most critical factor in assessing accuracy. For rare species known from only one or two specimens, growth charts essentially represent educated guesses based on related taxa rather than direct evidence. More common dinosaurs like Psittacosaurus, known from hundreds of specimens representing various growth stages, allow for much more reliable growth reconstructions. Large sample sizes enable researchers to distinguish between normal individual variation and actual growth patterns, identify potential sexual dimorphism, and establish confidence intervals for size estimates at different ages. The exceptional bonebeds of certain species, such as Centrosaurus and Maiasaura, which contain numerous individuals of different ages, have provided invaluable data for creating more accurate growth charts. Unfortunately, such comprehensive samples remain the exception rather than the rule in dinosaur paleontology.
Future Directions in Growth Chart Accuracy
The accuracy of dinosaur growth charts continues to improve through interdisciplinary approaches and methodological advances. Geochemical techniques analyzing stable isotopes in fossil bones now offer new ways to determine growth rates and metabolic patterns in extinct animals. Machine learning algorithms are beginning to identify subtle growth patterns across specimens that human researchers might miss. Improved dating methods provide more precise age determinations for fossils, helping to establish more accurate timelines for growth stages. Developmental biology insights from living archosaurs offer new perspectives on how genetic and hormonal factors might have regulated dinosaur growth. The integration of these diverse approaches promises increasingly sophisticated growth models in the coming decades. Additionally, new fossil discoveries, particularly of juvenile specimens and growth series from previously underrepresented dinosaur groups, will fill critical gaps in our understanding of dinosaur development across the evolutionary tree.
Conclusion: A Work in Progress
Dinosaur growth charts represent remarkable scientific achievements that synthesize complex data from multiple disciplines to reconstruct the life histories of animals that disappeared millions of years ago. However, their accuracy varies considerably depending on fossil availability, analytical methods, and the specific dinosaur taxa being studied. The most reliable charts incorporate multiple lines of evidence: fossil measurements across growth stages, bone histology, comparative anatomy, and biomechanical modeling. Even the best charts contain uncertainties and approximations that professional paleontologists recognize but that may not be apparent in public presentations. Rather than fixed, definitive representations, dinosaur growth charts should be viewed as scientific hypotheses subject to revision as new evidence emerges. This evolving nature makes them not less valuable, but rather perfect examples of the scientific process in action, constantly refining our understanding of these extraordinary animals that once dominated life on Earth.